Archive for the ‘Wireshark’ Category
Wireshark tid-bit: Looking for the smoking gun
It’s not always the network which is at fault but it is usually the network that is the assumed culprit. Wireshark can be a vital tool when troubleshooting difficult scenarios or prove that the network is not root cause. The purpose of this post is to ask questions and promote out of the box thinking when troubleshooting with Wireshark. Some common problems:
- The network is slow / This file transfer is slow
- My application responds after X seconds
- This application or agent is not working
These are very broad problem statements and depending on how familiar you are with the configurations and infrastructure, these can sound like daunting tasks to troubleshoot. At least until we start asking more questions and begin gathering the information we need to start troubleshooting. On occasion it is easier to capture packets on the source and destination endpoints then see what the packets tell us, will the packet capture align with the problem or will the packets point us in another direction?
When using Wireshark to troubleshoot such a board and undefined problem, where do you start? Wireshark is great at collecting details, Wireshark also presents all this information to us in an organized and digestable fashion. It’s up to us as network professionals to solve the mystery. Next up we’ll discuss some key items that will help expedite the troubleshooting process and make you more comfortable performing and reading packet captures. We will also ask some thought provoking questions to involve not just network-related technologies and issues.
Capture points and filtering options
The capture point is the foundation of your upcoming analysis. If you are not capturing at the correct spot (or spots) any future protocol analysis will either make the troubleshooting process more difficult and time consuming or you may find yourself going down the wrong path. It is always a good idea to review and understand the traffic flow which you are troubleshooting. Then ask yourself, will traffic be passing through my capture point? Could this traffic flow take another network path? Could another technology such as Virtual Port-Channel (vPC), Virtual-Chassis, load-balancers, load-sharing, ACLs (it can become quite a large list) be causing traffic to flow in another direction or drop the traffic flow all together? Depending on the size of the infrastructure is it possible to walk the path of the packet, following MAC, ARP, and routing tables?
Capturing at the right point is half of the battle, the next big question is what kind of capture filter do you need? Should you just capture everything passing through the interface in question? Some items to consider:
- If you perform an unfiltered capture and capture all the details:
- Will you create a performance bottleneck? Packet capturing can be resource intensive impeding network performance for production traffic flows.
- Will the packet capture be usable? The larger the packet capture the more time it takes to filter and analyze. You need to start filtering the conversation at some point either pre- or post- capture. Having all the data is great but will it be helpful?
- If you do decide to filter your capture what is your criteria?
- Source and Destination are always valuable but will that show you the entire picture? Will you see DNS resolution? Do you need to be aware of any HTTP redirects?
Timestamps
Being mindful of the timestamps logged in a packet capture, this information can help identify a wide array of different issues. Wireshark captures multiple timestamps, like almost every other field in the packet you can turn that field into a column this allows you to quickly identify gaps in time. You can take this a step further by marking a ‘reference’ packet allowing you to see the time delta from the reference packet. This can be useful when determining how long a requests takes or how long it takes a TCP handshake to complete.
e.g.: Why did the application server take 32 seconds to start transferring data? What was occurring during that 32 second gap? Perhaps there was a delay in receiving traffic from a backend database? Did you capture the backend flow too? Typically when a database is waiting on a transaction to complete you may see ‘keep-alive’ packets allowing the TCP connection to remain open/active while backend tasks are being performed. If you are troubleshooting a performance issue and see ‘keep-alive’ packets your next step may be to understand why the request is taking so long. Continuing with the database example, does a query need to be updated? Is the database fragmented? Does the server need additional resources (CPU/Memory/Disk/etc)?
Source and destination details
Don’t discount the source and destination details of the conversations. These details allow you to confirm the traffic is flowing the way you expect it to be going.
- MAC address – Does the source and destination MAC addresses line up with the expected network interfaces? Could the traffic be going a different path? Is there a misconfiguration causing traffic to flow over a different interface?
- I have seen colorful packet captures when LAG is enabled on the server-side but not on the network side. (This was not 802.3ad LACP)
- Dot1Q and IP details – Are you seeing the expected VLAN tags? Are any device dual-homed on multiple networks and could traffic be routed over an unexpected or different interface?
A packet capture can clearly show you what is happening, once you see what is happening you can then ask the question: Why is this happening? e.g.: A device receiving a packet on one VLAN but the response is received on a different VLAN, why is the response appearing on different network than which is was received?
Firewalls for instance allow you see packets getting ‘dropped’ or hitting the ‘bit bucket’, if you capture on both the rx and tx you expect to the see the same Dot1Q information, however if you find packets in the drop log with a different Dot1Q header than expected you can assume asymmetric routing and that may lead you to your root cause.
IP and TCP Options:
IP and TCP options provide an abundance of information about both the endpoints and the conversation:
- IP Length – The size of the packet can help identify packet loss involving MTU and fragmentation related issue.
- Fragmentation – What is the status of the DF-bit? Are overlays in play? How about Jumbo frames? Do you see certain packet size being transmitted from the source but not arriving at the destination? Do you need to move you capture point to identify the source of packet loss?
- Window Size and MSS – Much less a problem these days but does the TCP session have the appropriate TCP MSS and Window size are these setting being manipulated by a load balancer?
- IP Identifier – The IP ID field can be invaluable in the right scenario, especially when troubleshooting switching loops, routing loops, or even software bugs. I’ve done a previous write-up of the IP ID field and therefore won’t be going over the details again but I recommend giving it a quick read before finishing up here.
TCP Flags:
How is TCP behaving? Are you seeing the entire 3-way handshake? Besides capturing at the proper locations you also want to make sure your timing is correct, starting your capture before handshake occurs is vital to understanding the whole picture. The TCP handshake will include items discussed in the previous section such as the Windows Size and MSS, following the window size of a conversation may provide insight into packet loss or buffer issues on one of the endpoints. How about RST packets? It’s important to understand the application, some applications may not be coded properly and rely on RST packets to end connections as opposed to graceful closures with a FIN / FIN+ACK handshake. The last thing you want to do is go down the wrong path and assume something is wrong when it is indeed working as intended. (it may not be optimal but it may be as intended)
Protocol Dependancies
I briefly touched on this earlier in the post, it is good to see the full picture and follow the application / process in its entirety for example:
- When troubleshooting a connection issue are you are capturing the DNS resolution too?
- If you troubleshooting IP Storage or IP File access are you seeing any Kerberos or ticket authentication?
- Are you seeing a successful TLS handshake if you are working with a secure connection?
- In a security-conscience world do you see the RADIUS communication when troubleshooting device onboarding issues?
This post asked a lot of questions, as mentioned at the start this was aimed to provoke that out-of-the-box thinking: Am I troubleshooting this properly? Am I looking at the right pieces? Is there more to this issue than what I am considering? Hopefully some of these questions and examples did just that. I have other Wireshark posts on this blog, many of which are still valid after all these years, some stand-out ones to assist with troubleshooting:
As always, happy hunti…I mean troubleshooting!
As you can tell by my typos, grammar, sprinkled in references, and humor this post was written without the help of Artificial Intelligence (AI). These are my loosely organized ramblings.
Wireshark 3.0 Released

Recently, Wireshark dropped a major release which adds a few cool features (some new and some old). However outside of the new features, there is one major under the hood change this feature introduces. WireShark v3 for Windows now ships with Npcap as opposed to Winpcap that we have been used forever now. Npcap is actually part of the NMAP project which while Npcap is build of Winpcap Npcap gets a little more love in regards to up updates and being actively worked on. A while back I did a look at how Winpcap interacts with the NIC cards and captures packets, Even though Npcap is based off Winpcap I am curious to see if that underlying interaction has changed (more to come on that, or I’ll just update this blog post later on with my findings)
A few other features:
- IP Mapping has returned
- Monitor mode support for Windows wireless analysis. This is a huge one in my book, this functionality was brought over from the Npcap change.
- A few other random tidbit, bootp dissector is getting renamed to dhcp. Similar to SSL getting renamed to TLS.
- ciscodump now supports a proxy connection, I am going to need to check this out, as ciscodump utilizes the Cisco EPC capability. Which apparently I haven’t got to kick the tires on just yet. So, I think I am late to the game on this one, but proxy supports make this easier for some environments.
- There are quite a bit more changes, many new protocols were added and well as even protocols were updated.
For the sake of brevity I don’t to cover everything, just a few of the pieces are find more interesting and useful.
Link to the Wireshark release notes page.
Wireshark Tid-bit: De-crypt SNMPv3 in Wireshark
I recently found myself troubleshooting some SNMP connectivity between a particular set of devices and an NMS. Connectivity did not appear to be the problem as IP Connectivity was there and MIB walks were successful, however some interesting errors were still getting reported on the NMS. As I captured the packets to verify this connectivity, I said to myself ‘If only I can see what the NMS was asking for specifically and what device in question was replying back with’. This led me to check out the SNMP protocol settings in Wireshark, I mean Wireshark can de-crypt HTTPS traffic (with the private key) and wireless WPA traffic surely it can de-crypt SNMPv3. Behold it was true!! I was able to de-crypt SNMPv3 packets, and see what was really going on.
To add SNMPv3 information into Wireshark:
Access your Wireshark preferences: Edit -> Preferences -> Protocols -> SNMP

Where you see ‘Users table’ choose edit:
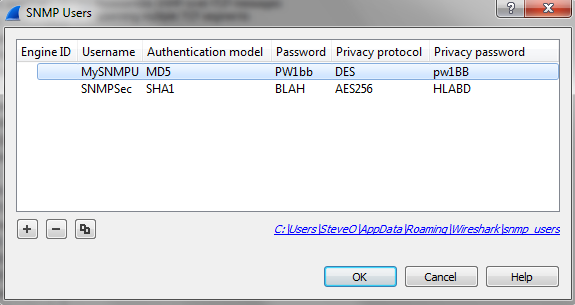
From here we can enter the SNMPv3 settings we need:
- Engine ID
- SNMP USer
- Authentication & Password – MD5 or SHA1
- Privacy & Password- DES, AES-128, AES-192, or AES-256
Once you enter the correct information and choose ‘ok‘ Wireshark will automatically de-crypt any relevant packets.
I feel like this is something I should have known about for a while now, but I supposed I don’t find myself troubleshooting SNMP connectivity too often. Figured I would get the word out there!
Wireshark Certified Network Analyst !!
Well, I finally took the time to buckle down and take the WCNA – Wireshark Certified Network Analyst. Once I finished up with the exam I can happily say I successfully past the exam which I have to admit is pretty cool. Protocol Analysis is definitely an interesting set of technologies to learn & know, it is also extremely beneficial for troubleshooting certain types of issues.
How I studied:
Having a few years a packet analysis behind me certainly helped, however the Wireshark WCNA Books from Wireshark University are absolutely fantastic!
The network analysis book, while it is expensive is definitely worth it. To me, this book is to protocol analysis; is what Routing TCP/IP Vol I & II is to a CCIE: R/S candidate. It is a large book with great material, a book you can keep on your book shelf at an arms length for years and still use for reference. This book will also cover all the WCNA Exam Objectives, making it an important resource if you are studying for this exam. The other great piece I loved about this book was all the real world case studies, it’s one thing for a book to teach you topic but it’s completely differently for a book to show you how this knowledge is applied in the real world. At the end of each the chapter the book points you toward PCAPs to test your newly learned knowledge which are available for free off the Wireshark book website.
Once you finish with the Network Analysis book, this is where the Prep Guide comes in. I bought the prep guide the weekend before my exam and went through all the questions, using that book to judge where I stand with the objectives. I did pretty well with the Prep Guide, missing maybe 10% of all the 300 questions so I figured it was time to schedule the exam and took it later that week.
I also read through the Wireshark 101 book, which in my opinion is a good book for anyone just starting out with Wireshark or if you want to start customizing wireshark. Which I highly recommend, however if you already familiar with Wireshark I’d skip over this one.
There are also a few great YouTube channels out there, with some great Wireshark videos and even some Sharkfest videos.
Just because I finished the WCNA, does not mean I will stop posting my Wireshark Tid-Bits I’ve still got plenty more of those in store.
Wireshark tid-bit: Use the command line
Many of us are familiar with the GUI version of Wireshark, but believe it or not but there are also a slew of other command line based utilities that enhance Wireshark and also aid us in capturing and analyzing data. Let’s take a quick look at some of these tools.
- tshark – This is pretty much the CLI equivalent of Wireshark. Allowing you to capture packets like you are using tcpdump, specifing interfaces, filters, etc. It’s definitely worth taking the time to get familiar with tshark.
- dumpcap – This is another CLI equivalent of Wireshark, however this utility writes directly to a file and is less feature-rich then its ‘tshark‘ equivalent. Think of this as the cheap and dirty Wireshark, hop into a system and initiate a dumpcap then boom you have your capture.

- mergcap – As the name implies, this tool allows you to merge multiple captures files into a single capture. Since, Wireshark does have a limitation on processing large file sizes you also have the ability to truncate packets after so many bytes. Similar to what we will do with editcap shortly.

- editcap – This is very nifty, allowing you to do many different things:
- Pick out specific time frames of a packet capture.
- Remove duplicate packets. In case you accidentally captured at multiple locations or fubar-ed your SPAN or TAP locations.
- Truncate packets after so many bytes. This is very handy incase you only want to look at packet headers.
In the below example I am taking an existing PCAPNG file and limit every packet to 40 bytes into a new file filter.pcapng. So you can decrease the file size making it easier for Wireshark process while still keeping the header information. 40-bytes is a bit much but hey it gets the point across.

- capinfos – Provides detailed information about the packet capture in question.
- Average Packet Size
- Time stamp information
- Data rate or packet rate
- Etc
In the GUI you can get most of this information from the ‘summary‘ -> ‘statistics‘ page which I covered in a previous post, but the CLI version can provide quick and easy access to this information without the need to even launch Wireshark.
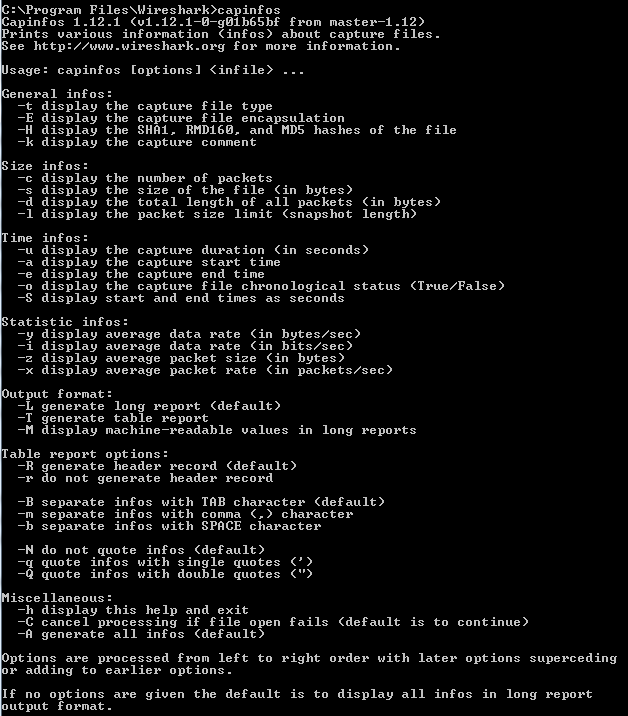
Capinfos CLI options
Sample output from capinfo is below:

Wireshark tid-bit: Using profiles & Coloring rules
Well, my first draft got lost in the cloud so let’s try this again!
The more you use Wireshark and the more familiar you get with protocols / packet analysis the quicker you realize what you may need to for. Luckily for us, if we know what we are looking for we can configure Wireshark to turn that needle in a haystack into a firework on the middle of Halloween. It does this by giving us the flexibility to control what information Wireshark displays to us and how Wireshark displays that information. The two most useful features we have are profiles and coloring rules, both of these are very powerful features and using both of these features together allows you to take your analyzing skills to the next level.
Profiles – Profiles give us the ability to control what information Wireshark displays to us, and how the information is displayed.
- Affecting the complete layout of the Wireshark display
- What columns are displayed in the Wireshark display
- Which coloring rules are in affect
Now, that we know some of the ways profiles affect Wireshark lets consider a few good use cases for profiles, below are a few profiles I have.

- Wired-VoIP – This profile will call out the DSCP field as specific column to easily keep an eye on QoS marking.
- Remote-Site-VPN – Calls out specific columns for the DF-Bit, IP & TCP length, and more fragment field.
- Wired-Transaction-Time – Contains specific columns for relative time & absolute time, etc.
Those are just a few ways profiles can be leveraged, and remember it is easy enough to flip from one profile to the next. There is no need to even close the current capture or restart Wireshark. This allows to quickly scroll through a single capture looking for key characteristics.
Coloring Rules – These coloring rules define how Wireshark displays the individual packets, it’s these same coloring rules that make re-transmissions show up in red. It’s important to remember that coloring rules are match from top-to-bottom and they will by specific criteria found in the packet. These coloring rules are tied to specific profiles, so you definitely want to keep in mind what profile you are working under.Below are a few of my coloring rules:

- WLAN-RETYU-PACKET – This filter looks to see if the packet is a retransmission of the RF medium. Might be useful if you are troubleshooting a WLAN performance issue.
- FRAG-PACKET – This rule calls out any fragmented packets by keeping an eye out on the ‘More Fragments’ bit. Could be a useful statistics if you working on performance issues in remote IPSec VPN locations.
- Kerberos_MSG – This filter actually picks any kerberos related packets, cause sometimes when Windows says the login failed due a network timeout it might really be due to a kerberos authentication issue. (FYI: Kerberos type 30 messages are errors. So you can be a bit more specific with this filter if desired)
- PC-1500-MTU – This Filter actually matches on two packet fields. First we make sure the packet is a ‘SYN’ packet, and then look to see if the TCP Max Segment Size is at 1460 which ideal for Ethernet networks. Sequentially, there is also a coloring rule for when the PC advertises a MSS that is not 1460. (PCI-NOT-1500-MTU)
Those are just a few examples to show how powerful the coloring rules can be, we can match on any field within the packet regardless of whether it is the Layer 2 MAC address or a piece of data with the application payload. Not mention we can match by multiple fields at the same time, talk about potential! The only thing I want to re-iterate is the matching is top to bottom, so in this example when Wireshark finds a Kerberos message it will hit the first coloring rule and no other even it is a retransmission. That is just something to keep in mind.
You can verify why a coloring rule is in affect by looking at the ‘Frame’ portion of the packet:

From the above, you can see which coloring rule we hit and why we matched this specific coloring. Very useful in the event we ever need to troubleshoot our own coloring rules.
So, now that we spent all this time creating profiles and coloring rules how do we back them up or transfer them to another laptop/desktop? Well, all these configurations can be transferred and backed up by copying only a few folders. If you are running Windows 7, you’ll find this under AppData\Roaming\Wireshark for your specific windows account.

It’s the Profiles folder we really want, once we take a look in there we see our specific profiles. Although you will probably be better off just copying the entire ‘Wireshark’ directory.


