Archive for the ‘Troubleshooting’ Category
Using regular expressions to make troubleshooting easier.
I’ve mentioned regular expressions throughout a few my articles over the last few years, usually as part of a configuration. However something I wanted to throw out there, is the fact you can use regular expressions with show commands. This can save quite a bit of time when bouncing between devices all day.
A few examples that I commonly use:
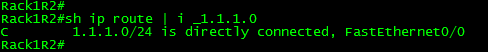
Let’s say you want to easily to pick out and view individual routes in the routing table or BGP table, here I used the underscore “_” regular expression to pick out only the route I wanted. This also works quite well to quickly see the default route.
Something I got tired of real quick, was checking interface errors since we all know issuing “show int” displays an awful lot of information, here I used the pipe “|” to look for multiple strings.

Let’s also say you need to quickly see the status of multiple interfaces on a chassis or stackable switch, we can use the brackets “[” “]” to look at a range of numbers, so you can easily view a particular interface across the stack or chassis, and/or even to see a range of interfaces across the stack/chassis. (I don’t have a functional stack in my lab yet but that RegEx would work across the first 2 stack members)

Now regular expressions are very powerful and there are quite a few I did not mention here. I highly recommend taking some time to go over them and see you can come up with. Feel free leave those findings in the comments below!
You can read more about the RegEx’s here.
Use your router to perform packet captures.
For quite some time now Cisco routers have had a feature known as EPC embedded packet capture, this feature allows you to perform packet captures directly on the interfaces making this one of the most useful features Cisco could implement (in my own opinion of course), a few things you can do with this feature:
- Listen to VoIP calls to verify quality
- Verify packet markings
- Troubleshooting connectivity issues
- and so on.
The best part of this, is the fact the configuration is fairly simple and you can begin capturing packets with just a few simple commands.
Here is a quick outline of the process:
- Create a buffer point
- Create a capture point
- Tie the buffer point & the capture together
- Start the capture
- Stop the capture
Now to dive a little deeper!
The buffer point is memory used to hold the packets captured and as we all know Cisco devices have a finite amount of memory on them and we would not want a packet capture to completely utilize all the space and cause other issues. So this where we limit what gets put in the buffer. On top of that we can also set filters based off an access-list in order to limit the packets we will capture, since in many cases we would not want to capture all the data traversing the router.


Buffer Point Options
Next we need to specify the capture point, this is where we specify the interface we want to capture on and in which direction we want to capture in. One thing you will need to specify is if you want to capture CEF or process switched traffic, this option in itself I think I just awesome (Of course most of the time you will capture CEF switched packets) but it’s nice to have the option. One thing I want to throw out there is yes you can capture on sub-interfaces.


You have the option to capture both IPv4 & IPv6 traffic
Now that we have created the capture point and the buffer point, we need to tie them together, this done with the following command:

All we need to do now is start then stop the capture, with the following command:

You can either manually stop the capture, or use one of the various options in the buffer point to trigger the capture to automatically stop.
Once the capture is complete you will most likely want to export the capture off the router and to your own workstation for deeper analysis in Wireshark or Omnipeek. You can export the capture off box by using protocols like TFTP or FTP, or even export the file directly to flash and come back to it later.
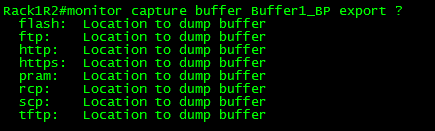
Buffer export options
Just think about the doors this opens for troubleshooting those odd random issues where you only wish you could capture the traffic for further analysis now you can!
Also think about the other cool things you can do with EPC:
- Utilize EPC on multiple interfaces at the same time, with multiple capture & buffer points. (Check out this page from Cisco)
- Use EPC in conjunction with kron jobs or EEM applets to perform on-demand packet captures.
- Much more
What if I told you… You don’t have to reload in 5!

For years I’ve been a fan of the reload in command it has always been a useful safety net when making changing that could essentially remove my ability to manage the router. Only recently have I found a feature that will actually roll back the configuration changes I make during a session without the need to reload the router! I don’t know about you but this is just an awesome feature due to the fact it is much less intrusive than the old way of reloading a routing and waiting for it to boot back up. Let’s quickly review this feature:
First we will need to configure a configuration archive, this is actually a prerequisite of the feature want to utilize for reverting our configuration.
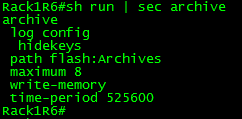
The above configuration simply does the following:
- Keeps a copy of the configuration backup on the local flash card with the directory ‘Archives’
- Keeps the last 8 copies of the configuration
- Takes a copy of the configuration when it is saved (Either using the wr mem command or copy run start)
- The configuration will also be saved automatically every 525600 minutes. (This is entirely optional I just included it)
And I used the following commands:

Now, that the configuration is enabled we can start using this configuration revert feature.
To use this feature all you have to do is use the following command when entering configuration mode config t revert timer x once you enter this command it take a backup of the current configuration of the router and places you in configuration mode:

If you try to utilize this feature without first configuring your config archive:

Now you can make any changes that you need. If you do not confirm your changes when you are finished the configuration will be rolled back to the snapshot taken.

You will want to enter the command config confirm to keep the router from rolling the configuration back assuming the change was implemented successfully:
![]()
I would like to add, it is possible to enter config with the revert feature, make your changes save the configuration to the start-config and then not confirm your changes. This will cause the running-config to revert back to its previous state but the startup-config will contain any changes made. So you have to be careful with this feature.
Now, I’ve been trying to beat this feature up in my lab all day, and so far it has not been perfect and I’ve seen some errors rolling back for some Frame-Relay configurations. I’ve went as far as to upload a router config from one of INE’s labs and then enter configuration mode with the revert feature enable and then post an entirely different router’s configuration over the existing configure just to see how the revert feature works. So far with the exceptions of some frame relay features it has been solid. It looks like I will start incorporating this new method into my normal day-to-day operations now I depending on the change I might still put in a reload in since you can’t be too careful especially if you are working devices that are in remote datacenters or located physically across an ocean. At least until I start feeling more confident with this feature.
Sending Syslog messages over TCP.
By default syslog run over UDP port 514, UDP as well all know is unreliable. Now lets say you have a couple of core devices and you wanted to ensure the syslog messages from these devices successfully arrived to your syslog server or NMS well in that case I would say your best bet would be to configure syslog to use TCP to send syslog messages to that destination. This is conveniently configured in on simple line:
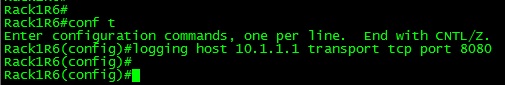
So now Syslog messages to 10.1.1.1 will be handled by TCP over port 8080, with that said you can even specify a different port number if you see it necessary, just remember to configure your syslog server to accept the syslog messages over the specific port that you can configure.
You can also use this configuration to change the default UDP port used by syslog if your environment calls for it. So instead of the default port UDP 514, syslog messages will be sent over UDP port 5514 in this example:

IOS Conditional Debugging
I while back I mentioned it is possible to debug a single IPSec tunnel using crypto conditions, this functionality also extends outside of crypto conditions. IOS routers offer the functionality to create debug conditions and limit debug output to specific interfaces, ip addresses, and more see the following list:

You can also stack these debug conditions on top of each other:

You will see as you specify additional conditions it tells how many conditions have been set. Issuing the command show debug condition will display a list of debug conditions that been set.

One thing you will want to keep in mind if you do not remove these conditions is when you finished troubleshooting your problem you should remove these debug conditions are else they will affect any other debugs you run in the future. You can remove these debug conditions by issuing the command no debug condition. One thing to keep in mind is that you have the ability to remove the debug conditions in any order, using the above configuration as an example lets say you want to keep seeing debug messages pertaining to IP address 192.168.1.254 and also pertaining to any interface and not just when it includes interface fa0/0, you can issue the command the no debug condition condition 1 or no debug condition interface fa0/0 depending which method you find simplier.

While conditional debugging is a very powerful tool when troubleshooting, you will still want remember that debugging can be very processor intensive and still might hinder performance on a production router, after all the debug is still running using debug conditions just limit the messages you will see.
The different between tracert and traceroute.
The fact that Windows tracert operates differently from the traceroute command in Cisco devices will almost always lead to an interesting discussion. Mainly because many people are not aware of the real differences between these two utilities, they are merely aware of the spelling differences and how could you blame them both commands give you very similar results and perform the same function.
Let’s look at a tracert from a Microsoft Windows workstation:

What to know here is the Window’s tracert utility is relying on ICMP echo requests. (So this is nothing more then an extension of a simple ping)

The other key difference between Windows and Cisco, is when the destination is reached it replies back with an ICMP echo reply:

Now when we look at traceroute utility from a Cisco device:

Now the packets:

What we see here is a UDP packet with a destination port of 33434 (The source port is almost always random), not an ICMP echo packet.

Now with Cisco the destination will not answer back with reply packet but surprising enough a destination unreachable packet. See below (Notice the source of the IP packet, it’s the destination of our traceroute)

So to recap, Windows Tracert utility relies on ICMP Type 8 (Echo Request) and Type 0 (Echo Reply) packets, while Cisco replies on a UDP probe packet with a destination port of 33434, and ICMP Type 3 (Destination Unreachable) packet.

