Control-Plane Protection & Control-Plane Policing
It’s not very common to see people jump on the idea of configuring Control-Plane Policing/Protection, a part of me thinks people avoid this subject like the plague because they feel it causes more problems then it is worth. Well, let’s be honest if you have had to troubleshoot a CoPP or CPPr policy you know it is fun process. Especially since checking the control-plane is not usually the first thing everyone looks at and half the time issuing a ‘sh run’ is just not an option at first.
The first thing we should probably clear up is, why should we protect the control-plane what is this going to do for us. Well let’s consider a few things the control-plane does:
- Handles packets that are not CEF switched, meaning the CPU has to take some time handle these packets.
- This is more important than you think, if the CPU is getting bombarded with a large number of packets the CPU must handle each one individually & it is possible the CPU will get too busy it start dropping other traffic.
- Maintains keep-alives for routing adjacencies.
- Handle traffic directed at the device itself
- SNMP/SSH, management traffic.
The control plane does a bit more then that but the three points above should get the point across.
The next thing I want to mention is how Control-Plane Protection (CPPr) differs from Control-Plane Policing (CoPP). Probably the main difference is the fact with CoPP you control access and limit access to the entire control-plane. This sounds good and simple but the control-plane is slightly more complex then that (go figure right). CPPr on the other hand allows us to control access to the individual control-plane sub-interfaces, providing us with more direct control. Here is a diagram from Cisco.com that lays out the control-plane:
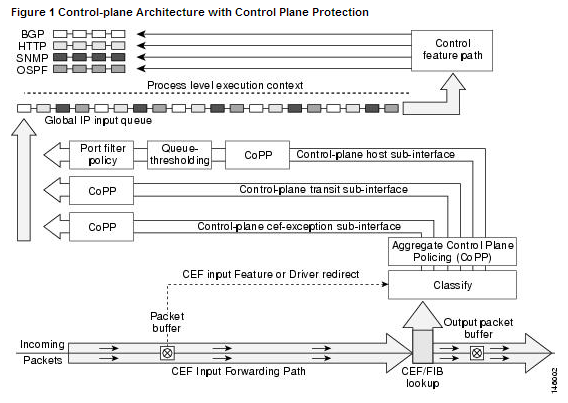
As you can see from the above diagram, applying a control-plane policy (CoPP) applies an aggregate policer to all traffic destined for the CPU. Reaching out of that aggregate you can see three addition sub-interfaces of the control-plane:
- Host – The host sub-interface handles traffic destined for the router or one of its own interfaces. IE: Mgmt related traffic and some routing protocol traffic. (EIGRP iBGP)
- Transit – This sub-interface handles software switched IP traffic. (I think also ICMP unreachable/redirects but I need hammer away at the ‘transit sub-interface’ a but more in the lab)
- CEF-Exception – This sub-interfaces typical handles non-IP related packets such as ARP, LDP, Layer 2 keepalives along with some routing protocol traffic. (OSPF eBGP)
Now, that we have an understanding of what the control-plane does for us, and the differences between CoPP vs CPPr let’s jump into some configurations. Luckily this configuration follows the framework of a typical QoS policy so if you familiar with the structure of the MQC you should be able to follow right along.
First we are going to create a few ACL’s to match our traffic:

Let’s put those ACL’s inside a few Class-Maps: (Only ACL’s, match ip DSCP/Precedence, & match protocol ARP are supported, hence why I did not do match protocol OSPF/BGP, if you do the command will get rejected upon trying to apply the service-policy to the control-plane)

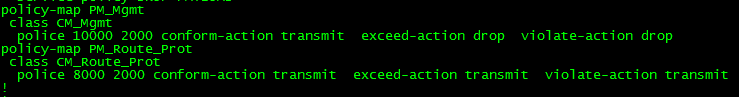
Now, we reference the Class-Maps within a Policy-Map and define our actions: (I’d like to make note, with a CPPr Policy-Map you can only use the ‘police’ or ‘drop’ actions)
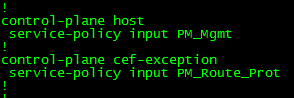
Finally we apply a service-policy referencing the Policy-Map we just created.
Now, that applies a CPPr policy to two different control-plane interfaces, if you simply want to perform CoPP you could do the following:

Combine our two separate policy-maps from before

Apply the Policy-Map to aggregate control-plane
Notice the console message, that CoPP has been enabled on the aggregate path. The CoPP policy shown in the above two pictures just about accomplishes the same thing as our CPPr Policy (With a few exceptions I want you to point out).
Using regular expressions to make troubleshooting easier.
I’ve mentioned regular expressions throughout a few my articles over the last few years, usually as part of a configuration. However something I wanted to throw out there, is the fact you can use regular expressions with show commands. This can save quite a bit of time when bouncing between devices all day.
A few examples that I commonly use:
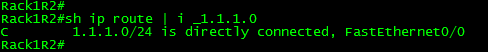
Let’s say you want to easily to pick out and view individual routes in the routing table or BGP table, here I used the underscore “_” regular expression to pick out only the route I wanted. This also works quite well to quickly see the default route.
Something I got tired of real quick, was checking interface errors since we all know issuing “show int” displays an awful lot of information, here I used the pipe “|” to look for multiple strings.

Let’s also say you need to quickly see the status of multiple interfaces on a chassis or stackable switch, we can use the brackets “[” “]” to look at a range of numbers, so you can easily view a particular interface across the stack or chassis, and/or even to see a range of interfaces across the stack/chassis. (I don’t have a functional stack in my lab yet but that RegEx would work across the first 2 stack members)

Now regular expressions are very powerful and there are quite a few I did not mention here. I highly recommend taking some time to go over them and see you can come up with. Feel free leave those findings in the comments below!
You can read more about the RegEx’s here.
A look at Flexible Packet Matching and a possible use case?
Flexible packet matching, definitely an extremely powerful tool and a complicated one at that, not only because of it’s configuration but also because you need to be familiar with the different protocol structures as well as regular expressions if you want perform some fancy matching criteria.
In a nutshell, Flexible packet matching allows routers to look deep into a particular type of packets, & into the various fields contained within the packet to perform specific actions based on the contents of those fields.
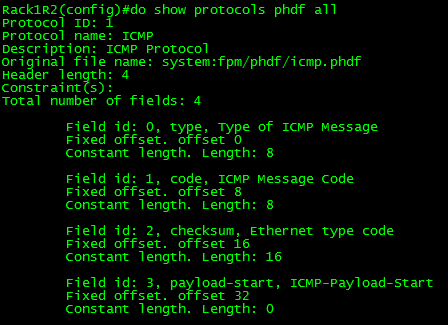
Before you can configure flexible packet matching, you will first need load a PHDF, Protocol Header Definition File. The PHDF is an XML file that outlines the format of the protocol header, the name of the fields, the length of the fields, and where the fields start within the packet. Below is sample of the XML text with the icmp.phdf:

To dwell on the PHDF for a bit longer:
- The field name matches a particular field within the header for the most case.
- The offset, denotes where the field starts in the packet header. The offset is always from the start of the header.
- The length, defines how long the field is.
- Notice the length and the offset can either be in bits or bytes
- The total length of the header at the bottom of the PHDF is also a requirement.
- This is all good to know since you can create your own PHDF files.
Here is a quick outline of an ICMP packet so you can correlate the PHDF to the to the actual packet.

To load the PHDF file itself, you’ll want to issue the following command:

After the PHDF is loaded you can issue the following command to see the specifics of the PHDF file itself. Similar to what is listed in the PHDF file itself.
Next, we are going create an ‘access-control’ class-map to match our traffic. I will keep the example to ICMP for simplicity:
![]()
Notice, we have multiple match statements, making sure we only look ICMP Echo packets, that have have a number with the first 256 byes of its payload. Now remember you can get pretty creative with regular expression, (If you’ve done any real work with BGP routing policies you know what I mean) for the sake of this post I wanted to keep it simple.
Now we need to create a ‘stack’ class-map, this particular type of class-map allows the router to narrow down its matching criteria by matching particular protocol headers in a particular order. If you do not specify a ‘stack’ class-map the the ‘IP’ header will be assumed. The example below matches ICMP over IP. Check out the INE link at the end of this post to see an advanced ‘stack’ involving ICMP within an IP-IP tunnel.
![]()
Since we have the ‘stack’ and ‘access-control’ class-maps defined it is now time we tie this together within a policy-map. Before we do that, we need to create an ‘access-control’ policy-map to match our ‘access-control’ class-map, and define our action when matching traffic is seen. There are only a few different options with ‘access-control’ policy-maps. (All of the pretty much listed below)

To tie together, the ‘stack’ & the ‘access-control’ class-map we will need to create another ‘access-control’ policy-map referencing the ‘stack’ class-map as a class, and then referencing the class-map containing our action as a service-policy.
![]()
With all the pieces tied together now, we can apply this to an interface:

So now, any ICMP Echo packets with a digit from 0-9 in the payload will get dropped, we can verify this by issuing the following show command:

Not an easy process, and quite a tedious one in fact. So what could you possibly use this feature for? Well this feature could be used as a psuedo-IPS to block a specific set of malicious traffic, or even to block ICMP Covert channels without the use of an IPS.
Here are some other resources for Flexible Packet Matching:
INE FPM Article – Great resource for showing off the power of FPM, by matching ICMP packets within an IP-IP tunnel
I highly recommend the Wireshark WCNA book for learning about the different protocols headers (and much more)
Use your router to perform packet captures.
For quite some time now Cisco routers have had a feature known as EPC embedded packet capture, this feature allows you to perform packet captures directly on the interfaces making this one of the most useful features Cisco could implement (in my own opinion of course), a few things you can do with this feature:
- Listen to VoIP calls to verify quality
- Verify packet markings
- Troubleshooting connectivity issues
- and so on.
The best part of this, is the fact the configuration is fairly simple and you can begin capturing packets with just a few simple commands.
Here is a quick outline of the process:
- Create a buffer point
- Create a capture point
- Tie the buffer point & the capture together
- Start the capture
- Stop the capture
Now to dive a little deeper!
The buffer point is memory used to hold the packets captured and as we all know Cisco devices have a finite amount of memory on them and we would not want a packet capture to completely utilize all the space and cause other issues. So this where we limit what gets put in the buffer. On top of that we can also set filters based off an access-list in order to limit the packets we will capture, since in many cases we would not want to capture all the data traversing the router.


Buffer Point Options
Next we need to specify the capture point, this is where we specify the interface we want to capture on and in which direction we want to capture in. One thing you will need to specify is if you want to capture CEF or process switched traffic, this option in itself I think I just awesome (Of course most of the time you will capture CEF switched packets) but it’s nice to have the option. One thing I want to throw out there is yes you can capture on sub-interfaces.


You have the option to capture both IPv4 & IPv6 traffic
Now that we have created the capture point and the buffer point, we need to tie them together, this done with the following command:

All we need to do now is start then stop the capture, with the following command:

You can either manually stop the capture, or use one of the various options in the buffer point to trigger the capture to automatically stop.
Once the capture is complete you will most likely want to export the capture off the router and to your own workstation for deeper analysis in Wireshark or Omnipeek. You can export the capture off box by using protocols like TFTP or FTP, or even export the file directly to flash and come back to it later.
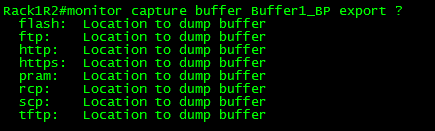
Buffer export options
Just think about the doors this opens for troubleshooting those odd random issues where you only wish you could capture the traffic for further analysis now you can!
Also think about the other cool things you can do with EPC:
- Utilize EPC on multiple interfaces at the same time, with multiple capture & buffer points. (Check out this page from Cisco)
- Use EPC in conjunction with kron jobs or EEM applets to perform on-demand packet captures.
- Much more
CCNP: Security track update!
Well, I managed to pass my VPN exam a few weeks ago meaning I got half my CCNP: Security since I passed FIREWALL sometime last year. So I started back on my IPS studies thinking life was all good, and then some friends on TechExam.net pointed out the fact the CCNP: Security track has a pending update!
It looks like the entire track is getting an overhaul! No more SECURE, IPS, FIREWALL, & VPN! Now we have:
SISAS – Implementing Cisco Secure Access Solutions
SITCS – Implementing Cisco Edge Network Security Solutions
SENSS – Implementing Cisco Security Mobility Solutions
SIMOS – Implementing Cisco Threat Control Solutions
(Honestly I think the site mixed up on some of those, SENSS looks like Edge Network Security Solutions to me, but we will see if Cisco updates the page)
They have also published a migration path for people that are currently going through the CCNP: Security track (Like I am)
SISAS <-> SECURE Replacement
SITCS <-> IPS Replacement
SENSS <-> FIREWALL Replacement
SIMOS <-> VPN Replacement
Looks like the old exams are still available until April 21st, so you have three months to tackle the original exams.
You can find more about the new CCNP: Security track here.
Along with the change it looks like Cisco is going to be retiring the many security specialist titles that come with obtaining the CCNP: Security exam. You can find more information about that here.
2 Exams in three months (IPS & SECURE), the race is on for me! Wish me luck!
Poll individual virtual server statistics on F5 LTM’s using SNMP.
It’s easy enough to log into an F5 LTM and view the current statistics concerning connections and other traffic statistics involving particular virtual servers but lets say you wanted to view this information over a specific time frame. Well that is were it gets a little tricky since you can’t view any historical information on the statistics page built-in on the F5 appliance. Which is one thing I really wish F5 would improve on, viewing historical performance information concerning virtual servers & pool members.
Luckily all the information found on the statistics page comes from internal MIB tables, meaning we can poll this same information into our NMS (Network Management Server) via SNMP. Finding the right OID is a bit tedious but it is a straight forward process. So lets run through at a high level regarding how to find out what MIB we need to poll for, and then we will look at an example.
- Decide which statistics you want to poll for. (Current Connection, Max Connections, etc)
- I recommend using a MIB Browser and Navigating to “1.3.6.1.4.1.3375.2.2.10.2.3.1” to see information that is available for you to poll for.

- Once you decide which statistic you want and you’ve located the OID in the MIB browser, copy or type it out the OID into notepad (or your preferred version of *pad)
- Now, go back to the F5 appliance and find the virtual server you want to collect this information from.
- Count the number of ASCII characters that are in the name of the virtual server. Including any underscores, dashes, etc.
- Once you this number tack it on to the end of the OID you copied in step #2.
- This is where the real fun begins. Now we need to convert the name of the virtual server from ASCII to Decimal. Including any underscores, dashes, etc.
- You can use an ASCII to Decimal calculator to make the conversation a bit easier.
- You will need to place a ‘.’ (Period) after each character in decimal format.
- Once you have the name converted decimal copy that information and append it to the end of the OID from step #4. (The OID in our notepad document off to the side)
- The OID you end up with, is what you need to poll for to get the particular virtual server information you are looking for.

To walk through this example one more time. Let’s say I want to poll for the number of current connections to a virtual server named ‘vs_web_http’.
- First I’m am going to find the OID for virtual server current connections.
Which is:
1.3.6.1.4.1.3375.2.2.10.2.3.1.12.
- The virtual server name has 11 characters in it, so now I need to update my OID with that information.
So my OID is now:
1.3.6.1.4.1.3375.2.2.10.2.3.1.12.11
- Now I need to convert the name of my virtual server to decimal.
vs_web_http converted to ‘118.115.95.119.101.98.95.104.116.116.112’
Now to add that to my OID:
1.3.6.1.4.1.3375.2.2.10.2.3.1.12.11.118.115.95.119.101.98.95.104.116.116.112
And there we have it, that OID right there will pull the current connections on the virtual server ‘vs_web_http’.
Here is a quick breakdown of the OID format. Any other statistics follows this same format, so if you are planning to poll for a few different statistics on the same virtual server you simple need to replace the beginning of the OID with the OID you want to poll for.

A few more extra details:
- OID “1.3.6.1.4.1.3375.” marks the beginning of the F5 private MIB structure, which is where it branches off into the different ‘applications’ (LTM, ASM, etc)
- OID “1.3.6.1.4.1.3375.2.2.10.” marks the beginning of F5 LTM Virtual Server information
- All the F5 LTM Virtual Server statistics OID: “1.3.6.1.4.1.3375.2.2.10.2.3.1.” are contained within a table so depending on your management server you may have to specify the table information, or set it as a ‘Counter64’. In my experience with SolarWinds, I had to set the UnDP to poll for the ‘raw value’
- You can download the F5 MIB directory off your F5 appliance from the main ‘overview’ page. This is pretty much your map for navigating the F5 MIB structure. There is a lot of useful information here if you have the time to actually dig through it. You can find a high level overview of the F5 MIB structure here.

Screenshot from the ‘overview’ page on the F5 appliance.

