Networking Field Day 9: First look- Monitor the network with NetBeez?!
With Networking Field Day #9 quickly approaching, I can’t help but start digging into the presenters and see what they currently offer.
In reviewing the presenters at Networking Field Day #9, one of them NetBeez offers an interesting take on network monitoring. I must admit this is one of the presenters I needed to do a little research on. Now, when I first went to the NetBeez homepage, the first thing I noticed was what they provide and bring to the table:

How many companies state they provide ‘end-user monitoring’ this to me is a unique twist on network monitoring. Think about it we have Application Performance monitoring, network device monitoring, traffic flow monitoring, & many others but end-user monitoring is not usually something you hear about too often.
Like many of us have, I have been using IP SLA across many networks to give me a perspective as to what the user what might be experiencing. While this is a good idea it is however slightly flawed in my opinion, my reasons below:
- It’s not really from the user’s perspective. (Usually)
- Usually the IP SLA is configured on a distribution or core device. NOT from the access layer.
- IP SLA does not scale very well.
- How are you going to manage all these IP SLA’s?
- You need to be careful when/where configuring or terminating a large number of IP SLA’s on individual routers, they require resources to run! You can very easily go overboard!
- Reporting and monitoring.
- Can you report on the IP SLA statistics? How long were response times above a certain threshold vs. within a reasonable expectation?
However, after reviewing NetBeez I see some potential. As their solution does appear to address some of those concerns & flaws:
- True user perspective
- NetBeez devices can be connected directly to the access layers, providing a network perspective AS A REAL USER. Albeit at the cost of a single switchport.
- Scalability
- The NetBeez devices are managed from one central management console, easing the management of this monitoring solution to a single console.
- Now your infrastructure devices simply need to pass packets in the data plane and service clients not worrying about the additional load of the IP SLA processes.
Now these are just some of my initial impressions, I am quite curious to see this product in action, to see if they live up to my impressions, and what they have in store for the future. In my opinion this product has a lot of untapped potential.
A few things I am curious about:
- Cost – I’ve worked with many companies were I could easily deploy 50 to a few 100 of these little devices. Many of know the budget is a big decision maker, can these useful little guys break the budget?
- Consolidated Data views – Deploying a lot of these guys might get overwhelming quickly and I am curious how efficiently this data can be summarized.
- Reporting – With all this useful information I am wondering if the data is kept for historical purposes and can be reported on later. I think being able to report on response times for the various applications (HTTP, DNS, etc) can easily provide trending capabilities after a 3 month time frame.
- Support for additional applications, or advanced monitoring capabilities- Many companies will be running some type of home grown application, can NetBeez devices be configured to perform simple TCP handshakes over specific TCP ports? What about taking HTTP monitoring a step forward and navigate down a few pages instead of a single HTTP GET, maybe even reporting on individual page elements. eCommerce is a very large and metric driven business that could definitely benefit from advanced HTTP monitoring.
- Most importantly can we run monitors between different NetBeez devices
Now, don’t think of those curiosities too harshly, network monitoring is a topic I tend to be overly critical about (Just ask anyone I have worked with)
With all that said I this should be a very interesting presentation, and one I am looking forward to.
Field Trip: Networking Field Day
![]()
Very excited to announce I was invited to participate in Networking Field Day #9.
The first question is: What is Networking Day? Well it is an event where we (networkers) get to participate, listen, and interact with various different vendors.
And I’ll be joining a great group, a few of which I’ve met at the last few Cisco Live’s and some of which I’ll be meeting for the first after many interactions on Twitter and the Web.
- Bob McCouch
- Brandon Carroll
- Brandon Mangold
- Charles Galler Jr.
- Ivan Pepelnjak
- Jody Lemoine
- John Herbert
- Jonathan Davis
- Jordan Martin
- Lindsay Hill
- Nick Buragilo
- Pete Welcher
- Me – Steve Occhiogrosso
Which vendors will be at Networking Field Day #9, well there will be a few of them:
This looks like a very interesting line-up It’s got some bigger players and some newer players that look to be offering some very intriguing products products. Everything from ‘SDN WANs’ to Network Monitoring.
This whole event will be streamed live so you can watch as everything unfolds! I’ll post the link soon!
Hello 2015!

Hard to be believe 2014 is gone and and 2015 is here! Yea I know we are already a few days into 2015 but hey for some reason I still hear people saying “Happy New Year”, much like I still Christmas decorations out.
So what’s in store in for 2015!? Well we are going to find! I got a few things on my punch list: (always got to keep thinking ahead right?!)
- Finish my CCNP: Data Center
- Knock out the WCNA, Wireshark Certified Network Analyst. Figure by now I’ve got a decent amount of time clocked using Wireshark
- Maybe brush up on some wireless technologies, my CWNA is about a year an half old now and renewal is slowly creeping up. Or maybe look at the CCNP: Wireless, but I don’t think that track has been updated in a while.
- Deepen my knowledge of Voice.
- Been debating on expanding the videos available on this blog. Or maybe even doing a podcast, I’ve bouncing the idea off the wall for quite some time now. Of course the term podcast might be an over-statement I’m thinking of maybe some recording technical discussions amongst friends.
It’s always nice to reflect on the past and what 2014 provided:
- CiscoLive 2014 San Francisco, met up with a great people again and had a blast, learning some new things in the process!
- Twitter – Got to admit Twitter is always fun and amazing resource. Big shout-out to the people that make my twitter entertaining and and lively!
- Cisco Champions – Interacting with another great group of networking enthusiasts is always a great experience!
- Exams!! I Think I knocked out 7-8 exams last year, finishing off my CCNP: Security, getting my CCNA: Data Center and falling one exam short of my CCNP: Data Center. I’m really starting to think the toughest part of getting a certification is acting finding the time to make it to testing center! But boy was 2014 a busy year.
- SolarWinds Thwack Ambassador, got to post articles involving VoIP Monitoring & Troubleshooting for month over at Thwack. Being able to interact with a community that great was a real treat in itself!
- 27 New posts went up on this blog, that is honestly much more than I thought I did, putting me well past the 100 post mark!
- I might need to a running count on the number of bottles of Whisk(e)y I drink this year.
- Too much more to even mention!
Here’s to 2015!
Packet Flow with FirePower.
As I was going through some CiscoLive365 sessions (Remember CiscoLive365 is great!) just this last weekend I came across the slides for BRKSEC-2028 – Deploying Next Generation Firewall with ASA & Firepower services. Unfortunately there is no video for this session yet but the presentation slides are there and luckily the slides are detailed enough so you can easily follow along with the content. One the slides that stood out of to me was where the new FirePower modules (Hardware or Software) falls into the order of operations as traffic passes through the ASA. Screenshot below:

I think the big call-outs here are:
- The FirePower module will not actually drop the traffic itself, the traffic gets ‘marked’ if the traffic is to be dropped. All the traffic that passes to the FirePower module will indeed get passed right back to the ASA and it is the responsibility of the Cisco ASA to actually drop the traffic.
- Even existing connections still get inspected if the security policy demands.
- ACL’s and XLate entries will filter traffic before the traffic even makes it to the FirePower module.
- This is only slightly different from how the existing IPS Module inspects traffic from ASA. In regards to the flow path.
Definitely some good information to know when building out your new policies.
Wireshark tid-bit: Quickly gathering the contents of a PCAP.
I don’t know about you but when I find myself performing packet captures and analyzing PCAPs I usually only know the symptoms of the issue I am attempting to troubleshoot. IE: Connection timeouts, slow response, long transfer times, etc. I usually don’t know much more than that, only in rare occasions do I get a heads up and insight into the behaviors of the application I am trying to troubleshoot. For all the other situations I need to rely on the PCAPs and interpret what and how the applications are communicating. Whether or not the application is behaving properly and performance is as it should be or if there is indeed something amiss somewhere.
Now for me the easiest way to do this is by using the reviewing the ‘Summary’ page under the ‘Statistics’ menu. A sample summary page is below:
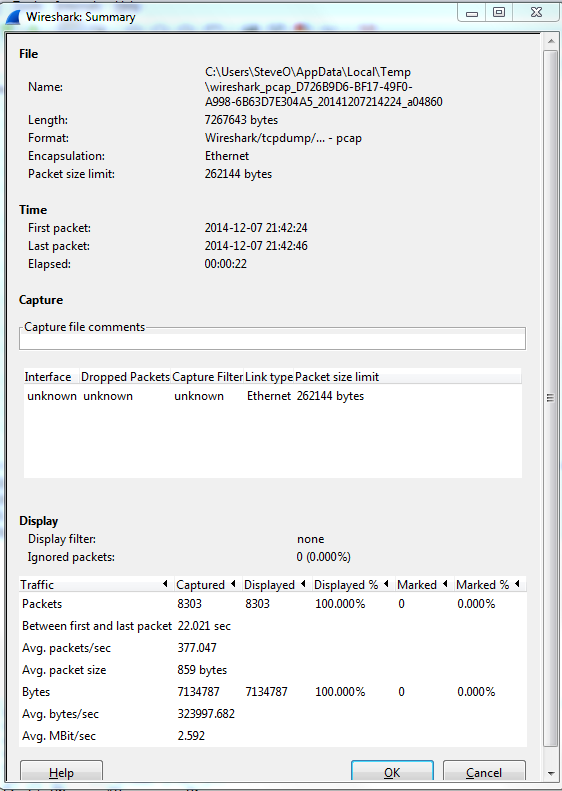
A few great call-outs from this screen:
- Packet Size Limit -Knowing whether or not the packets within the capture were sliced after the first so many bytes is important to know, as sometimes you might not see the entire TCP header or wireshark will start classifying the packets as malformed. Although you will also see a ‘Truncated’ message within the packet indicating the packet was sliced.
- First Packet, Last Packet, & Elapsed time -Matching up the time of a packet capture with when the particular issue occurred is crucial, after all you don’t want to find yourself analyzing the wrong capture. The Elapsed time is important to make note of as this give you the ability to establish a baseline, knowing how long a process takes can you help you identify an issue or identify expected behavior in the future.
- Avg. Packet Size – Depending on what you are trying to troubleshoot the average packet size can be a quick indicator in regards to whether or not your fully using the MTU an your network. If you are troubleshooting data transfers normally you would expect the Avg. Packet to be quite large. If you see exceptionally small packet sizes data transfers may take a lengthy amount of time due to the increase TCP overload and normal L3 forwarding. Same goes for the Avg Mbit/sec, if you have large packets flowing you can expect to see a higher throughput rate, and the opposite for lower packet size rate.
The next spot that is worth checking out is the ‘Conversations’ which is also found under ‘Statistics’ this quaint little window gives you a brief overview of any Source/Destination devices identified within the capture. From an L2 Ethernet perspective up to a L4 TCP/UDP Perspective allowing you see what end points are really involved with this communication along with how much data was sent, the length of time the connection, etc. It’s not completely unheard of for applications to communicate with other devices (Web Servers, DB Servers, File Servers, Other App Servers) to perform whatever tasks it is trying to perform and it could be very possible this third server may or may not be slowing down the process.

So by using these two windows in Wireshark you’ve identified the following:
- The length of time the process take. – Found in the elapsed time of the capture, as long as the entire process was captured that is.
- The endpoints involved with this communication. – Remember it is important to cut down as much background noise as possible.
- How much data is transferred and at what size & rate. – This can very helpful when working data transfers.
Wireshark Tid-bit: What does the IP Identification field tell us?
There are many different fields in the various headers we get to examine during packet analysis, one of the most overlooked field is the IP Identification field. This simple 16-bit field is displayed in Hex and has a few different uses, most importantly:
- Identifies fragmented packets.
- Identifies the individual packets that the sender transmits.
How does this help us?
- Well, by reviewing the IP Identification numbers you can easily identify which packet was dropped in the conversation, by comparing the packet captures from two different capture points.
- This field can also give us a glimpse at how busy the end-devices are. The IP Identification field will increase by ‘1’ for every packet from the sender. Remember the IP ID Value is specific to each individual and not to a specific conversation. If you are following a specific conversation we may see consecutive IP ID #’s or we could see large jumps in the IP ID # intervals. Depending on the numbers this could tell us if the end-devices could be overloaded, or under-utilized and depending on the situation that could point us to a smoking gun.
- If the packets get fragmented they will have the same IP ID number, the Fragment Offset field will also be set as well. This is helpful in following a conversation over particular link changes.
- Seeing the same IP ID #’s in the same packet capture could also identify switching or routing loops within our network. The IP ID #’s will always increase, seeing the duplicate numbers means were are seeing the same packet more than once. The first thing you want to do is verify your capture point is functioning properly and make sure your capture point is in the right spot. Once you verified that it’s time to go hunting for the loop.
Quick Example:
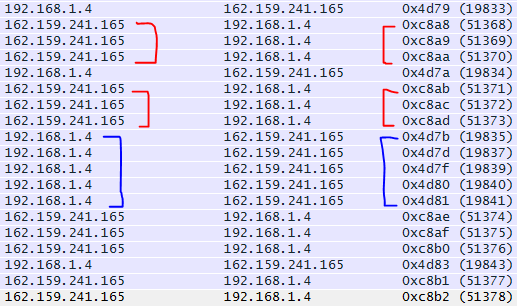
By reviewing the IP ID numbers of the packets what can we tell about this conversation with Wireshark.org?
- All the IP ID #’s are unique, no routing/switching loops
- The IP ID #’s are pretty consecutive on both sides of the conversation. Showing both endpoints are not being highly utilized at this point in time. In fact there are one or two gaps on the 192.168.1.4 side of the conversation showing that endpoint is a little busier than 162.159.241.165

