CCIE Challenge 1: Manipulating EIGRP Routing
So last week (Well actually months ago at this point) I was helping out one of buddies who is working on his ROUTE exam and he was working through an EIGRP load sharing lab involving the variance command and interface metrics, after I read through the lab and looked at the requirements I came up with a completely different way to complete lab then what was expected. So I figured I would alter the lab and post it up here:

Objectives:
- You want R1 to load share over links Serial0/0 and Serial0/1 that connect to R2 to reach the 3.3.3.3 /32 prefix on R3.
Rules:
- You cannot make any configuration changes to R1.
- You cannot create any static routes.
- You cannot create any additional interfaces.
- You cannot configure any additional routing protocols. (IE: OSPF, BGP, etc)
- You cannot change any AS types.
- You cannot change which EIGRP ‘k’ values are being used.
- You cannot change any of the metrics on the existing interfaces.
- The solution must involve EIGRP.
You can download the starting configurations here:
There is also a GNS3 .Net file included in there as well.
Have Fun!
Old Cisco Live sessions a great free resource!
Believe it or not, but the old Cisco Live sessions are available to view free of charge! You can search through the available sessions here. It looks to go as far back as 2011, and you can filter the videos by using various methods technology, product line, technical level, event location, and a few others along with a free text search option.
Many of these sessions include the recorded videos along the presentations in PDF format. No matter type of technology you are looking for there is bound to be some material for it. I’ve watched a few of these sessions already sessions ranging from advanced DMVPN deployments, Nexus 5k best practices, performing wireless site surveys and others. I highly recommend you browse some videos when you have spare time, I guarantee you will learn something new.
P.S. I’ll be at Cisco Live Orlando this year (and the INE event)! So feel free to drop me or comment or send me a DM over twitter @StephenO86 and we can schedule a meet-up when the time comes!
Knowing the different Cisco LAP modes.
It’s been a while since my last wireless post, and surprisingly I never done a post regarding the different modes a Cisco LAP can operate in. I figured this would be a great place to start up my wireless posts again!
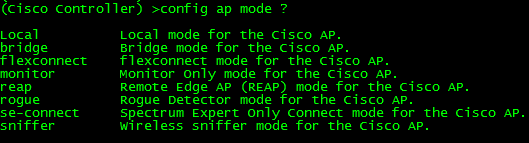
Now depending on the model access point you are working with and which IOS you are running you may or may not be able to operate a LAP in all the modes I will be describing:
Local: Probably the most common and well-known mode a LAP operates in mainly because this is the default mode a LAP will operate in (Unless you are running Flex controllers). In local mode, the LAP maintains a CAPWAP (or LWAPP depending on your IOS version) tunnel to its associated controller. All client traffic is centrally switched by the controller which why LAPs have been referred to as ‘dumb’ APs, primarily due to the fact it does very little thinking on its own. As a matter of fact, if a LAP operating in local mode loses its connection to the WLC, the LAP will stop forwarding and begin looking for the controller. Until the LAP (operating in local mode) joins another WLC it will not forward any user traffic.
REAP/H-REAP/Flexconnect: This mode has certainly evolved over the years and certainly deserves multiple posts of its own. REAP stands for Remote Edge lightweight Access Point and is there to address the scalability issues with Local mode after all it is completely unfeasible to place a WLC at every branch location. If you had every LAP operating in Local mode and you experienced a WAN failure at the location housing your WLC, every LAP in your network would stop forwarding user traffic, crippling your wireless networks. LAPs operating in REAP mode do not always require a connection to the WLC, and have the capability to locally switch WLAN traffic without relying on the controller. The functionality of REAP was later expanded to H-REAP (Hybrid-REAP) getting a littler better with each code release. Later on H-REAP was later re-branded again being called Flexconnect gaining a host of new features.
Bridge: Bridge modes have been around a long time, and as you would expect allows you to bridge together the WLAN and the wired infrastructure together.
SE-Connect: SE-Connect mode allows you to connect to the LAP using Cisco Spectrum Expert and gather vital information about the RF spectrum surrounding the LAP. Do keep in mind a LAP operating in SE-Connect mode will not be broadcasting an SSID and does service any WLAN clients. This mode is strictly used for troubleshooting purposes.
Sniffer: Similar to SE-Connect mode, a LAP operating in Sniffer mode is strictly for troubleshooting purposes. Sniffer mode will passively monitor the surrounding WLAN environment (Over a specifically configured channel) and tunnels all the 802.11 WLAN traffic to an end point on your network (configured by you), where you can use protocol analysis tool (Wireshark, Airopeek, etc) to review the packets and diagnose issues.
Rouge Detector: Again similar to SE-Connect & Sniffer mode, Rouge Detector mode does not service any WLAN clients. Rouge Detector mode connects to your wired infrastructure usually over a trunk link and watches the traffic traversing the VLANs. The LAP in Rouge Detector mode is watching for any MAC addresses that other LAPs have marked as a wireless ‘rouge’ device. Think of this as a tag team match up, your LAPs operating in Local or H-REAP/REAP/Flexconnect modes are passively watching and reporting rouge APs and rouge WLAN clients, while the LAP in Rouge Detector mode is watching the wired network for the MAC addresses of those same rouge APs and rouge WLAN clients. It’s there to be an extra layer of security in the event your users connect rouge APs, you use a Rouge Detector LAP detect and alert on those events.
Configuring the AP mode can be from the CLI of the WLC using the following command: config ap mode %AP Mode% %AP Name%
Portfast and Multicast traffic
In my last post I covered the Spanning-Tree Portfast feature and the advantages it has on our network, covering the concept of TCN packets and the effect TCN packets have on our networks. I did however forget to mention another side effect the TCN packets cause involving multicast traffic. When a topology change occurs and a TCN packet is set to the spanning-tree root bridge the root bridge transmits a global leave message with a multicast group address of 0.0.0.0, this in turn causes the switches to flood multicast traffic out all ports until it receives a few general queries (the default number will depend on the switch model and IOS). So this simply identifies another potential resource issue that can be caused by not configuring Portfast. There a few configuration options we can set that can make this process less intrusive:
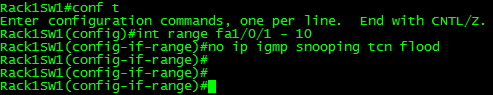
- Outright disable the flooding of multicast traffic when a TCN is transmitted, This is configured on an interface by interface basis.
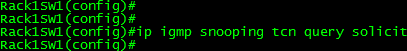
- Tell the router to transmit a query message – Configured on the switch from global config mode, whenever a switch notices the TCN packet it sends a packet out to tell the router to solicit a query message, decreasing the amount of time it takes the switches to receive “x” amount of queries to recover from the TCN event.
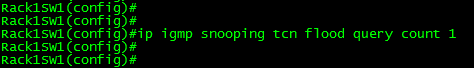
- Specify the number of queries to wait before the switch stops flooding multicast out all ports – This configures the switch to stop flooding multicast traffic after it has received “x” amount of queries. This feature in conjunction with the solicited query message feature can significantly reduce the flooding time.
Why and how to configure Portfast.
We all know the big advantage of configuring Portfast, a port configured with Portfast will immediately start transmitting data in the ‘forwarding’ state bypassing the other spanning-tree states. This is certainly a great feature to have configured on your downstream ports connecting to your end-user workstation or your servers. There is also another great reason to configure Portfast on your client edge ports, that is not such widely known.
Whenever a switchport goes up or down the switch generates a TCN (Topology Change Notification) packet and sends this TCN packet to the root bridge, the root bridge then responds back with a TCA (Topology Change Acknowledge) packet simply to acknowledge the TCN packet. The root bridge then transmits another BPDU with the TC (Topology Change) bit set to every switch within the Spanning-Tree domain. When the other switches receive this TC marked packet it resets the aging time of every entry in the CAM table (Also known as the MAC address table) down to 15 seconds which can cause the switch to rebuilt it’s it CAM table if the entries start aging out. Now depending on the size of your layer 2 network this can waste a lot of resources on your switches. Not to mention causes a lot of unnecessary traffic overhead, since we have a set of BPDUs transmitted with the TCN, TCA, and TC flags set individually. Keep in mind also, that if CAM table entries start expiring this can cause unnecessary ARP traffic for additional information the switch already had.
Now let’s review some of this:
Here is a port configuration, without portfast:
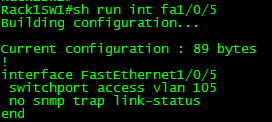
When we disconnect and reconnect fa1/0/5, we get the following log output:

In that previous screen shot, you’ll notice the first thing that happens is spanning-tree sends out that TCN BPDU, and interface is marked as down. I then reconnect the cable to fa1/0/5 and you see the port go through the spanning-tree stages, from listening to learning and finally to forwarding. (Extra credit which version of spanning am I running?) Something to notice as well is the fact another TCN BPDU packet is sent as the port is set back in the forwarding state.
Now let’s configure Portfast on this switchport:

Now again lets disconnect and reconnect this port again:

There is much less going on here compared to our previous experience, the important thing here is to notice there are no TCN transmitted not when the port is marked as down nor when the port marked as up (or forwarding). The only STP events that are registered is the fact port fa1/0/5 goes directly to the forwarding state from the blocking state bypassing the listening state and the learning state, allowing the client to start using the network even quicker.
Now, let’s sit back in our chair for a second and think about this for a minute. A TCN is sent out when the switchport goes down and again when the switchport enters the forwarding state. So when an end user decides to reboot their PC, when they undock their laptop to go to a meeting, dock back in at their desk again, or when they decide to re-organize their desk and unplug their PC a TCN wills be transmitted causing the switches to lower the aging timers of entries in the MAC address table. That could be a lot of unnecessary resource utilization.
P.S. Remember to enable BPDU Guard when enabling portfast! Portfast is great a tool but because it skips the listening and learning states you run the possibility of create layer 2 switching loops if cross connect multiple switches or your users start connecting simple switches/hubs at their desks. BPDU Guard will place a port in an Err-Disabled status if it receives a BPDU on that port.
Sending Syslog messages over TCP.
By default syslog run over UDP port 514, UDP as well all know is unreliable. Now lets say you have a couple of core devices and you wanted to ensure the syslog messages from these devices successfully arrived to your syslog server or NMS well in that case I would say your best bet would be to configure syslog to use TCP to send syslog messages to that destination. This is conveniently configured in on simple line:
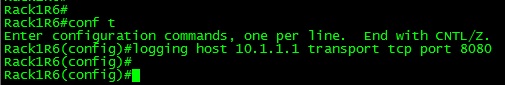
So now Syslog messages to 10.1.1.1 will be handled by TCP over port 8080, with that said you can even specify a different port number if you see it necessary, just remember to configure your syslog server to accept the syslog messages over the specific port that you can configure.
You can also use this configuration to change the default UDP port used by syslog if your environment calls for it. So instead of the default port UDP 514, syslog messages will be sent over UDP port 5514 in this example:


