Archive for the ‘Wireshark’ Category
Wireshark tid-bit: Quickly gathering the contents of a PCAP.
I don’t know about you but when I find myself performing packet captures and analyzing PCAPs I usually only know the symptoms of the issue I am attempting to troubleshoot. IE: Connection timeouts, slow response, long transfer times, etc. I usually don’t know much more than that, only in rare occasions do I get a heads up and insight into the behaviors of the application I am trying to troubleshoot. For all the other situations I need to rely on the PCAPs and interpret what and how the applications are communicating. Whether or not the application is behaving properly and performance is as it should be or if there is indeed something amiss somewhere.
Now for me the easiest way to do this is by using the reviewing the ‘Summary’ page under the ‘Statistics’ menu. A sample summary page is below:
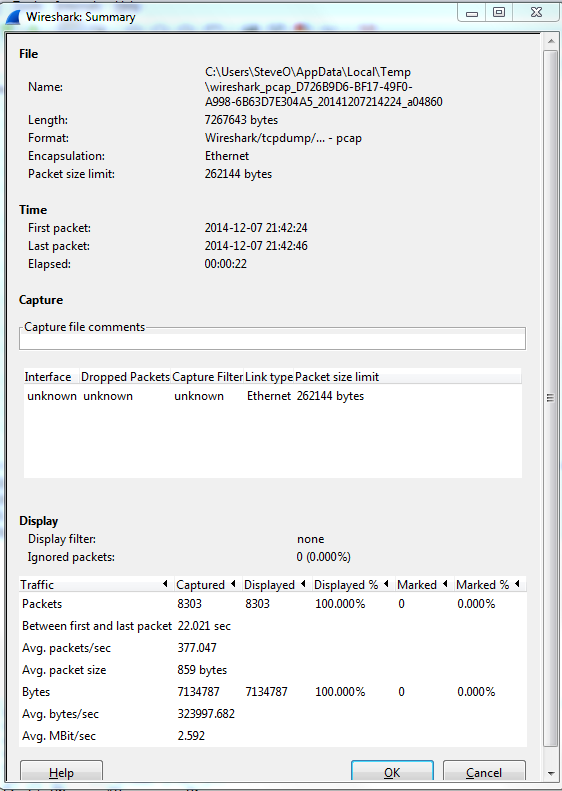
A few great call-outs from this screen:
- Packet Size Limit -Knowing whether or not the packets within the capture were sliced after the first so many bytes is important to know, as sometimes you might not see the entire TCP header or wireshark will start classifying the packets as malformed. Although you will also see a ‘Truncated’ message within the packet indicating the packet was sliced.
- First Packet, Last Packet, & Elapsed time -Matching up the time of a packet capture with when the particular issue occurred is crucial, after all you don’t want to find yourself analyzing the wrong capture. The Elapsed time is important to make note of as this give you the ability to establish a baseline, knowing how long a process takes can you help you identify an issue or identify expected behavior in the future.
- Avg. Packet Size – Depending on what you are trying to troubleshoot the average packet size can be a quick indicator in regards to whether or not your fully using the MTU an your network. If you are troubleshooting data transfers normally you would expect the Avg. Packet to be quite large. If you see exceptionally small packet sizes data transfers may take a lengthy amount of time due to the increase TCP overload and normal L3 forwarding. Same goes for the Avg Mbit/sec, if you have large packets flowing you can expect to see a higher throughput rate, and the opposite for lower packet size rate.
The next spot that is worth checking out is the ‘Conversations’ which is also found under ‘Statistics’ this quaint little window gives you a brief overview of any Source/Destination devices identified within the capture. From an L2 Ethernet perspective up to a L4 TCP/UDP Perspective allowing you see what end points are really involved with this communication along with how much data was sent, the length of time the connection, etc. It’s not completely unheard of for applications to communicate with other devices (Web Servers, DB Servers, File Servers, Other App Servers) to perform whatever tasks it is trying to perform and it could be very possible this third server may or may not be slowing down the process.

So by using these two windows in Wireshark you’ve identified the following:
- The length of time the process take. – Found in the elapsed time of the capture, as long as the entire process was captured that is.
- The endpoints involved with this communication. – Remember it is important to cut down as much background noise as possible.
- How much data is transferred and at what size & rate. – This can very helpful when working data transfers.
Wireshark Tid-bit: What does the IP Identification field tell us?
There are many different fields in the various headers we get to examine during packet analysis, one of the most overlooked field is the IP Identification field. This simple 16-bit field is displayed in Hex and has a few different uses, most importantly:
- Identifies fragmented packets.
- Identifies the individual packets that the sender transmits.
How does this help us?
- Well, by reviewing the IP Identification numbers you can easily identify which packet was dropped in the conversation, by comparing the packet captures from two different capture points.
- This field can also give us a glimpse at how busy the end-devices are. The IP Identification field will increase by ‘1’ for every packet from the sender. Remember the IP ID Value is specific to each individual and not to a specific conversation. If you are following a specific conversation we may see consecutive IP ID #’s or we could see large jumps in the IP ID # intervals. Depending on the numbers this could tell us if the end-devices could be overloaded, or under-utilized and depending on the situation that could point us to a smoking gun.
- If the packets get fragmented they will have the same IP ID number, the Fragment Offset field will also be set as well. This is helpful in following a conversation over particular link changes.
- Seeing the same IP ID #’s in the same packet capture could also identify switching or routing loops within our network. The IP ID #’s will always increase, seeing the duplicate numbers means were are seeing the same packet more than once. The first thing you want to do is verify your capture point is functioning properly and make sure your capture point is in the right spot. Once you verified that it’s time to go hunting for the loop.
Quick Example:
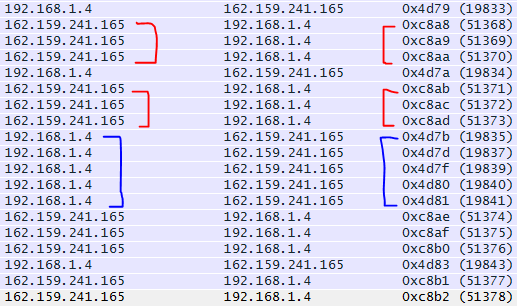
By reviewing the IP ID numbers of the packets what can we tell about this conversation with Wireshark.org?
- All the IP ID #’s are unique, no routing/switching loops
- The IP ID #’s are pretty consecutive on both sides of the conversation. Showing both endpoints are not being highly utilized at this point in time. In fact there are one or two gaps on the 192.168.1.4 side of the conversation showing that endpoint is a little busier than 162.159.241.165
Wireshark tid-bit: Packets larger than the MTU size.. why, how?
Ever so often when I was doing some packet analysis I would come across systems that were sending packets larger the Ethernet MTU of the segment. Or so I thought those packets were getting transmitted, eventually I finally figured out why I was seeing packets with an increased packet size.
The answer was large segment/send offload (LSO) – When this feature is enabled it is the responsibility of NIC Hardware to chop up the data ensuring why it conforms to the MTU of media/network segment.

Now that we know why we are seeing these large packets, the next part of the question is how are we seeing these large packets in Wireshark. Well, Wireshark relies on WinPCAP or LibPCAP depending on your platform, these two tools capture the packets just before the packets hit the NIC Card and get transferred to the actual network.

The above image is from Winpcap.org, showing the kernel level NPF just above NIC Drive, thus explaining how Wireshark is able to see the larger traffic. Before it hits the NIC Driver and gets segmented due to its LSO capabilities.
Winpcap.org – Winpcap Internals

